
It was almost 9 pm when Farhana opened the fabric consumption report for the third time that night.
She was a merchandiser at a mid-size knit factory outside Dhaka, and she had costed this order herself, three months ago, sitting at her desk with a calculator, a sample cutting, and a fabric consumption sheet that said 1.85 meters per garment. The buyer had approved the price. The order had shipped. Everyone was happy.
Except the fabric bill didn’t match.
The finance team had sent over the actual purchase and issue numbers, and instead of 1.85 meters per piece, the cutting room had used 2.02 meters per piece. On an order of 40,000 pieces, that gap alone came to almost 7,000 extra meters of fabric. At the price they were paying for that fabric, it worked out to a number that made Farhana put her phone down and just stare at the wall for a minute.
She wasn’t angry. She was confused. Nobody had done anything wrong, exactly. The pattern master had made the marker the way he always did. The cutting room had cut the way they always cut. And yet, somehow, the numbers didn’t add up.
This is a story that plays out in garment factories every single week, all over Bangladesh, Vietnam, India, and everywhere else clothes get made. And almost every time, the answer is hiding in one word that most people outside the cutting room barely think about: the marker.
What Is a Marker, Really?
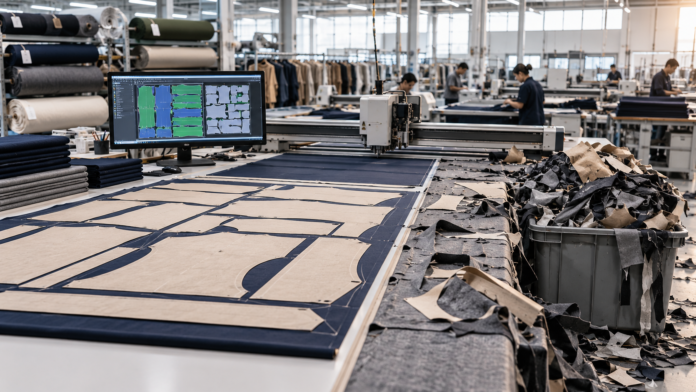
If you’ve never stood in a cutting room, here’s the simple version. Before any fabric gets cut, someone lays out every pattern piece — the front, the back, the sleeves, the collars, everything — on a digital canvas the width of the fabric roll. This layout is called the marker. It’s basically a jigsaw puzzle. The goal is to fit as many pattern pieces as possible into the smallest amount of fabric, with almost no wasted space between them.
Think of it like packing a suitcase. Two people can pack the exact same clothes into the exact same suitcase, and one person will fit everything in with room to spare, while the other will struggle to zip it closed. The clothes are identical. The skill of the packer is what makes the difference.
A marker works the same way. Two pattern masters can be given the exact same pattern pieces and the exact same fabric width, and one will come back with a tighter, smarter layout than the other. The difference between them, multiplied across thousands of garments, is what people in the industry call marker efficiency.
The Number Nobody Talks About Enough
Marker efficiency is just a percentage. It tells you how much of the fabric inside the marker is actually being used by the garment pieces, and how much is empty gap, wasted space that gets thrown away.
An efficiency of 85 percent, for example, means 85 percent of that fabric becomes clothing, and 15 percent becomes scrap. Anywhere from 80 to 90 percent is considered the normal, acceptable range for most styles, with simpler shapes — like basic t-shirts — sometimes climbing even higher, and more complicated, curvy styles naturally sitting a bit lower. That’s not laziness. Curved pieces just don’t nest together as tightly as straight ones, the same way round fruit leaves more gaps in a box than square boxes stacked together.
Here’s the part that should keep every merchandiser up at night: fabric usually makes up 60 to 70 percent of the total cost of a garment. It’s not labor, it’s not trims, it’s not overhead. Fabric is the single biggest number on your costing sheet, by a wide margin. Which means a small slip in marker efficiency doesn’t stay small. It goes straight into the most expensive line item you have.
Doing the Math, the Simple Way
Let’s go back to Farhana’s order for a second, because numbers make this real in a way that percentages never quite do.
Say a factory is costing a style at $6.00 worth of fabric per piece, and the order is for 50,000 units.
If the marker efficiency is running at a healthy 88 percent, the fabric cost holds close to that $6.00 figure, and everyone’s margin stays where it was promised.
Now imagine the marker is only hitting 80 percent efficiency — still technically inside the “acceptable” range that most factories consider fine, nothing alarming, nothing anyone would flag in a meeting. That 8-point gap quietly translates into roughly 8 to 9 percent more fabric being consumed than necessary, just to make the exact same 50,000 garments.
On $6.00 of fabric per piece, across 50,000 units, that difference isn’t pocket change. It’s the kind of number that can eat an entire season’s profit margin on a single style — and nobody in the factory did anything obviously wrong. The marker just wasn’t as tight as it could have been, and nobody checked.
This is the trap. “Acceptable” and “optimal” are not the same thing, and the gap between them is where money disappears.
It’s Not Just the Marker’s Fault
Here’s something Farhana learned the hard way, sitting with the head cutting master, a quiet man named Karim bhai who had spent almost twenty years on the cutting floor.
“Apa,” he told her, tapping the marker printout on the table, “the marker on paper looks fine. Eighty-six percent, very good number. But what happens on the table is a different story.”
He was right. Marker efficiency only measures what happens on the CAD screen. It doesn’t account for everything that goes wrong once real fabric, real scissors, and real people get involved. There’s a whole second layer of waste that lives outside that clean percentage:
End loss — a little bit of fabric wasted at the very start and end of every single ply in the fabric lay, because you can’t cut right up to the edge cleanly.
Width loss — fabric rolls that come in slightly narrower than what was promised, forcing the pattern pieces to be squeezed in awkwardly, or leaving unusable strips down the side.
Selvedge waste — the tightly woven edges of the fabric roll that can’t be used for garment pieces at all.
Mismanaged end-bits — the leftover pieces at the end of a roll that are too short for a full marker, and often just get pushed aside, forgotten, and never counted against anything.
None of this shows up when someone tells you “the marker is at 86 percent.” It shows up later, when you compare what the marker said you’d use against what the cutting room actually used. And that gap between the two numbers is exactly what Farhana found sitting in her inbox that night.
The Two Numbers Every Merchandiser Should Be Asking For
After that night, Farhana changed one small habit, and it changed everything about how she costed her next orders.
On every bulk order, she started asking cutting for two figures, not one:
The marked consumption — what the CAD marker predicts fabric usage will be.
The achieved consumption — what the cutting room actually used, once the real cutting was done.
If those two numbers were close, she knew her costing sheet could be trusted. If there was a real gap between them — not a rounding difference, but a pattern that kept repeating — she knew something upstream needed fixing before it happened again on the next five styles.
It sounds like such a small thing. Two numbers, one comparison. But it was the difference between costing a style based on hope, and costing it based on truth.
What Actually Helps
Karim bhai and Farhana ended up working together more closely after that, and a few things made a real difference over the following months.
Mixing sizes into one marker instead of cutting them separately helped the software find tighter combinations, since more shapes gave it more flexibility to fit pieces together like puzzle pieces of different sizes. It’s a small technical choice, but it consistently pushed efficiency up compared to running single-size markers.
They also stopped accepting whatever number the auto-nesting software spit out as final. The software is a tool, not a decision-maker. Someone still needs to look at the layout and ask, honestly, “is this actually as tight as it can get, or did the software just settle for good enough?”
They pushed back on the fabric supplier about roll widths too. A roll that’s a few centimeters narrower than promised doesn’t sound like much, but across a whole order, inconsistent widths are one of the sneakiest causes of wasted fabric, and it’s something a merchandiser can actually negotiate at the sourcing stage, long before cutting ever begins.
And instead of comparing the whole factory against one general “industry average” efficiency number, they started tracking efficiency style by style. A single factory-wide number hides more than it reveals. It was always a handful of specific, more complicated styles quietly dragging the average down, while the simpler ones were doing just fine.
Why This Belongs on the Merchandiser’s Desk
It would be easy to think marker efficiency is a cutting room problem, something for the pattern master and the CAD operator to worry about, far away from costing sheets and buyer negotiations. But that’s exactly the mistake Farhana had been making without realizing it.
A costing sheet is a promise. It tells the buyer what the price will be, and it tells the factory what margin it can expect to keep. If that promise is built on an assumed, average, “should be fine” efficiency number instead of the real number the cutting room can actually deliver, the promise is broken before the order even starts. Not because anyone lied. Just because nobody checked.
Fabric is too expensive, and too large a share of the garment’s cost, to be treated as a rounding assumption. It deserves the same attention merchandisers already give to CMT negotiations, delivery dates, and buyer relationships.
A bad marker doesn’t send an email. It doesn’t show up in a meeting agenda. It just quietly takes a small bite out of the margin, order after order, until someone finally sits at their desk at 9 pm, staring at a fabric bill that doesn’t add up, wondering where the money went.
The good news is, once you know where to look, it’s not hard to find.